Bellingcat OSINT Challenges - Multispectral Viewpoints Writeup
Puzzles by Galen, Bellingcat - with inspiration from this guide.
1. Take You to the Beach

What a lot of water!
This image was captured by Landsat 8, a satellite that orbits the Earth every 99 minutes. It captures images in multiple bands of the electromagnetic spectrum.
Here, you just see the visible light bands, which are the ones that are most similar to what the human eye sees.
But where was Landsat-8 looking when it captured this image?
What is the name of the archipelago in this image?
The are a myriad of archipelagos in the world, and narrowing them down to a singular result might be challenging without the use of image recognition technologies. Google Lens (reverse image search) assists us here.
In the description of the challenge, we are provided with a North-facing, complete satellite image of the main island. Images such as this can typically be found on the covers of online articles, or as geographical reference material for all manners of online content. It’s an easily-accessible and highly-explanatory image, which makes our chances of finding it during a reverse image search very likely.
Our results outline this theory as well.
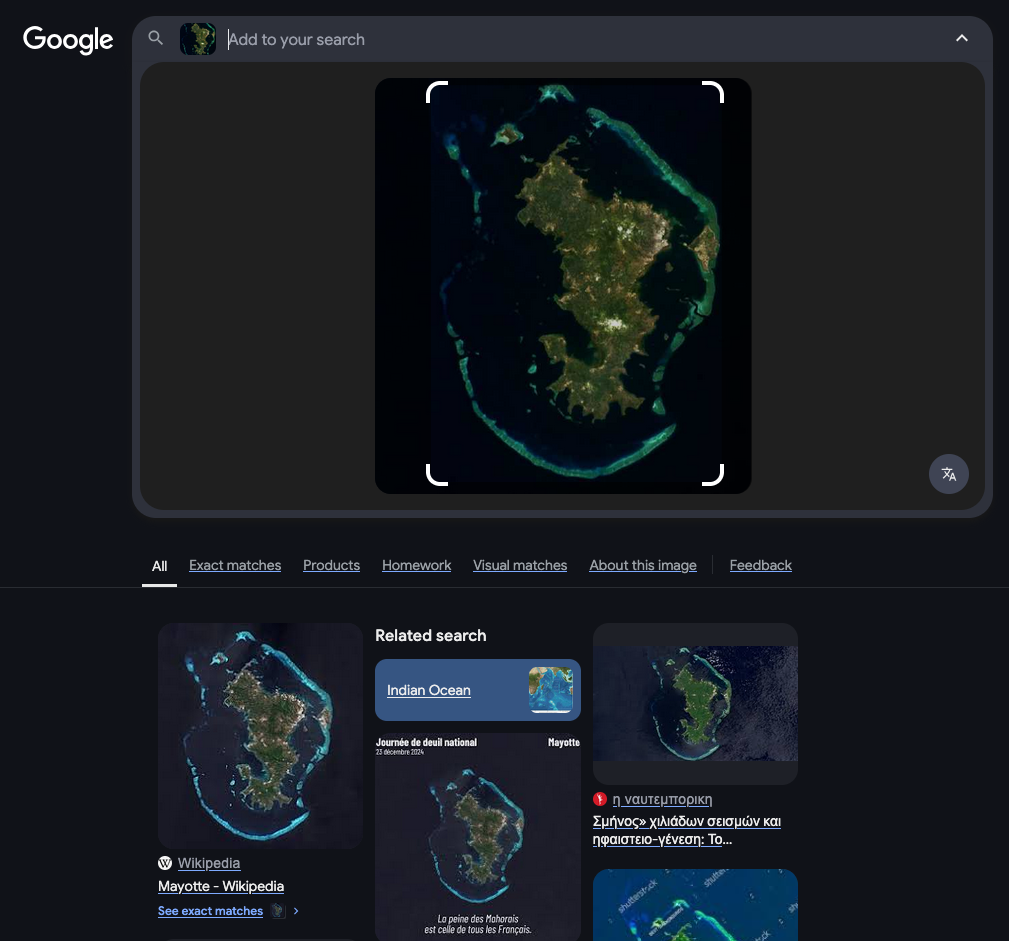
The first result is an article on the Department of Mayotte, consisting of its two main islands, Grande-Terre (big island) and Petite-Terre (little island), part of the French territories in Madagascar.
Answer: Mayotte
2. Down by the Sea

Why does it look like a brain?
This image was captured by Landsat 8, but uses a 'band ratio' instead of the visible light bands.
The band ratio is a way to combine two bands of the electromagnetic spectrum to highlight certain features.
But which features are highlighted?
What is the ICAO code of the airport in this image?
Reading the guide linked in the challenge description, we find a section about the monitoring of bauxite mining activities through the use of band ratios from multispectral imaging results.
Band ratios highlight the contrast between different bands by dividing the values of pixels in one band by those in another. When determining which ratio to use to highlight a given material, we look for the parts of the light spectrum where the material reflects the most and least light. By dividing one by the other, it’s possible to pinpoint very specific materials.
Agnes Cameron, Bellingcat Tech Fellow
With this in mind, we take a look at the reference image given by the challenge, and at the article. The explanatory image found under the “Case Study: Bauxite Mining in West Kalimantan” section of the article showcases the use of band ratios, and the result looks similar to the challenge image.

This hints towards our subject of interest being a bauxite mining facility. Researching a list of the top largest bauxite-producing facilities in the world, we find that everything points to Weipa Mine, Queensland, Australia being the right answer.

We proceed to look up the area using Bellingcat’s Multispectral Imagery Explorer tool. From the right-hand side, we also select the pre-made Bauxite Mining Band Ratio Comparison. This will reveal that the location is the one referenced in the challenge image as well.

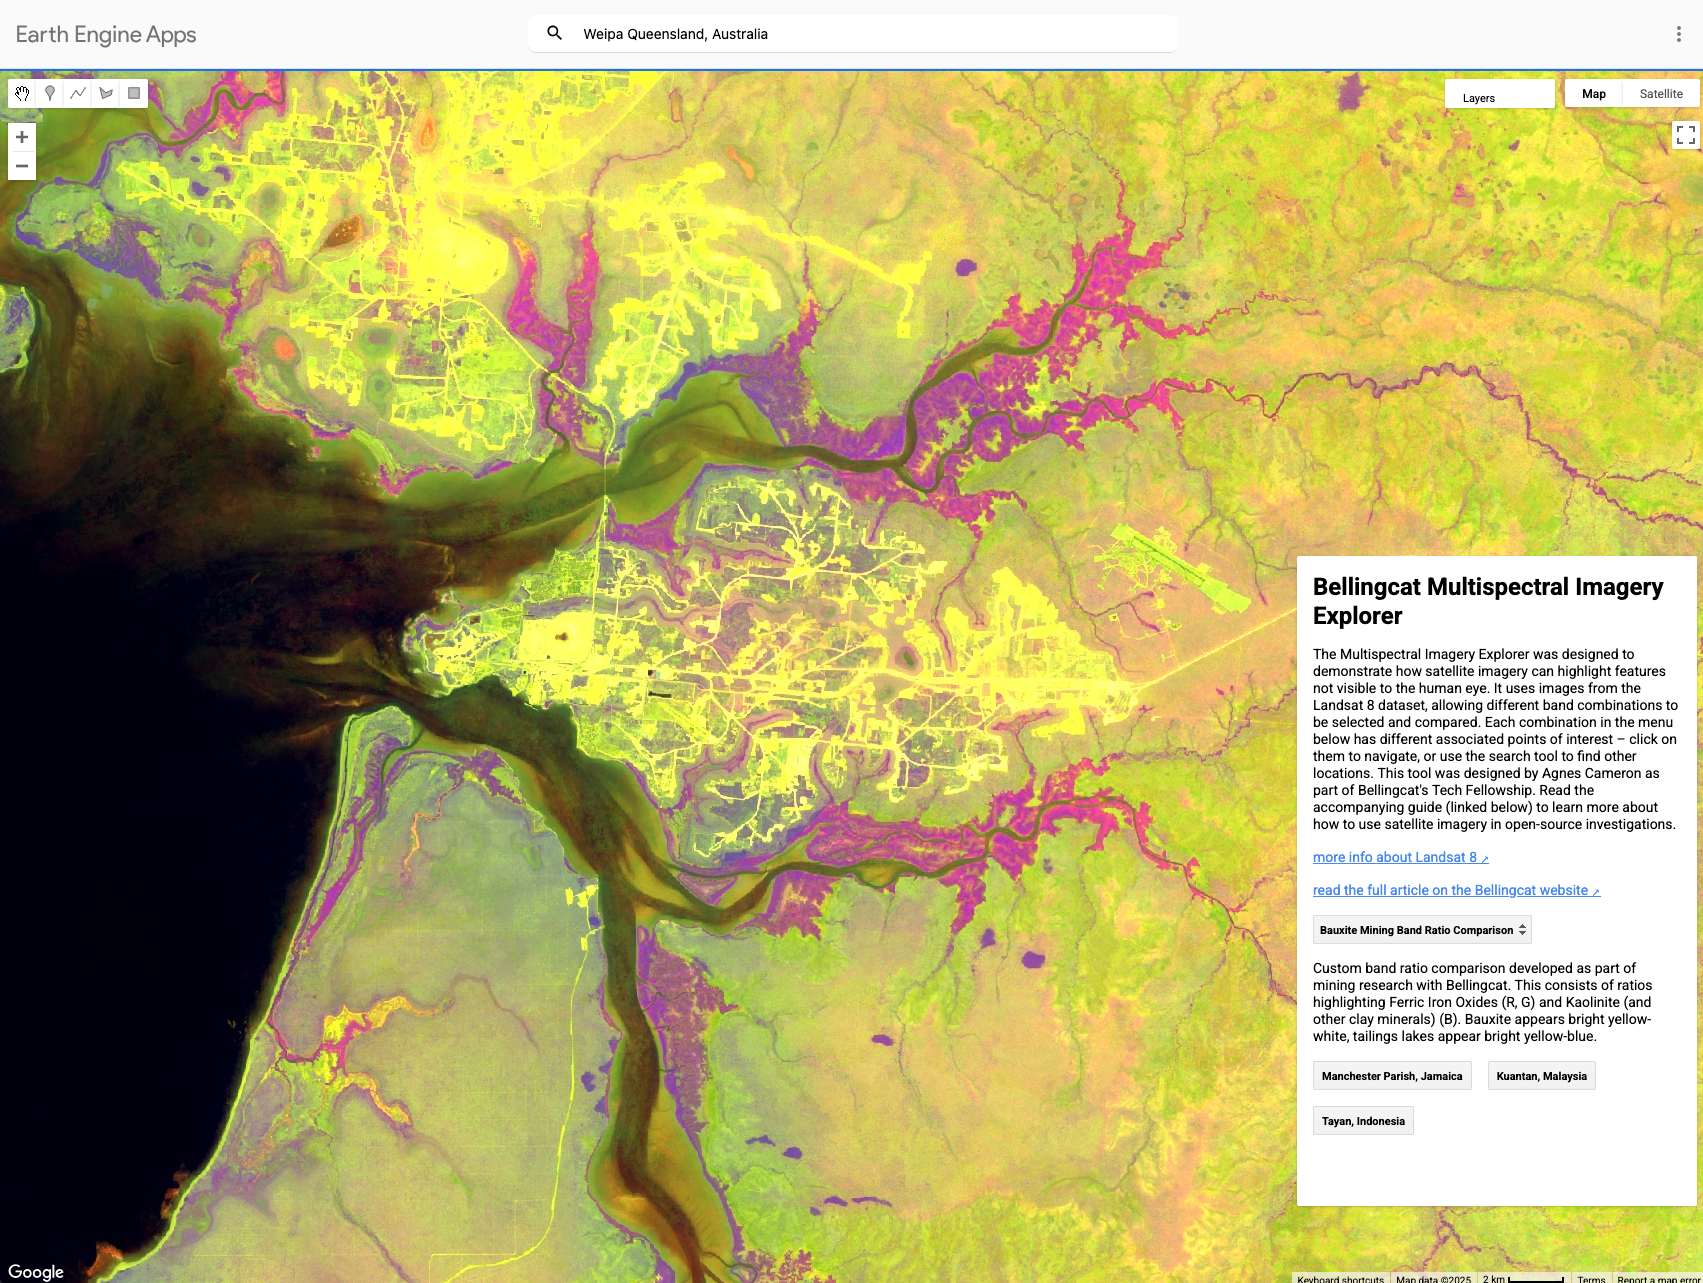
Using an easy Google search, we can find out the ICAO identifier for Weipa Airport. Disregard the airport to the North-East of Weipa, that’s an RAF base.
Answer: YBWP
3. Make the Water Turn Black

But what does the blue mean?
This image was captured by Landsat 8, and shows a combination of the shortwave infrared bands.
This combination is useful for differentiating between different kinds of vegetation, and monitoring soil health.
But here, it's highlighting something else...
What is the name of this body of water? (omit the descriptor word i.e. 'Lake', 'Reservoir', etc)
In the challenge image, a SWIR (Short Wave Infra-Red) band combination is used, specifically one that makes water turn black, and includes relevant results in a blue colour. A summary search reveals that the SWIR, NIR and Green band combination results in exactly this.
SWIR - Red channel
NIR - Green channel
Green - Blue channel
Because water and wet soil stand out in this band combination, it is valuable for monitoring floods. Saturated soil and sediment-laden water will appear blue. Clear water will show as black.
Newly burned land reflects SWIR light and appears red in this combination. Hot areas like lava flows or fires are also bright red or orange. Exposed, bare earth generally reflects SWIR light and tends to have a red or pink tone. Urban areas are usually silver or purple, depending on the building material and how dense the area is.
Since plants reflect near-infrared light very strongly, vegetated areas are bright green. The signal is so strong that green often dominates the scene.
The pattern of blue, orthogonal plots remind us a lot of salt pans / salt flats. These are salt processing pools that appear as “sedimented” water using the band combination we spoke about before. The example below is from the Boneville Salt Flats in Utah, United States.

Researching the largest salt-producing countries on the Globe, we get a number of results. We proceed with searching the largest ones for each country in hopes of producing a result.

In India, three locations pop up in the immediate results for salt production:
Gujarat
Tamil Nadu
Rajasthan

Following are satellite imagery results for the 3 locations mentioned above.


The third result is a match with our reference image. This is situated at Shakambari Jheel, Rajasthan, India. “Jheel” means lake, so we remove it from the final answer as instructed by the challenge prompt. The correct answer is the neological version of the word Shakambari. The word Sambhar is derived sometime during the 19th century from the original Shakambari name, which refers to a historical figure.

Answer: Sambhar
4. Kind of Blue

Shallow water, deep mystery.
This image was captured by Landsat 8, and shows a combination of the shortwave infrared bands.
We can see an area of land that is usually dry, but fills with water during the rainy season.
What is the name of this topographic depression?
This one was a quick Google Image search away due to its unique clarity and shape, but it required the “salt flat” key word for good results.

Makgadikgadi Pans is the name of the complete formation of pans in this region. Technically, this can be called a basin, as it fills up with water during the rainy season. This formation is composed of Nxai Pan, Khama Khama Pan, Ntwetwe Pan and Sua Pan.
If I were to be more academic about it (I am not), I would say that a person who knows more geography can deduce the basin definition from the description of the challenge, then research for salt flats present in basins around the world. Alas, I am but myself.
Answer: Sua Pan
5. Dandelion

It looks nothing like a flower!
This image was captured by Landsat 8, and shows a band ratio that highlights different minerals and rock types.
The psychedelic colors are not what you would see with the naked eye, but they help geologists identify different types of rocks and minerals.
What is the name of this highest peak in this image?
Referenced here is the method devised by Sabreen Gad and Timothy Kusky, namely the Advanced Space-borne Thermal Emission and Reflection Radiometer (ASTER) band ratio sensing. On the perimeter of the image, displayed in bright red and yellow hues is a body of water, leading us to believe this is either an island or a peninsula.

As an example, you can see the Tocantins river Brazil, displaying the same red and yellow hues. Nearby, the Carajas Iron Mine shows how iron would reflect in this band ratio.

The presence of multiple hues in our challenge image points to a metamorphic mountain peak, possibly volcanic, due to the various different materials detected by the sensor. Metamorphic mountains are defined by the presence of multiple, stratified materials forming one unitary structure. The paper by Sabreen Gad and Timothy Kusky details this analysis.

To confirm our assumption of it being a volcanic island, we land at Katla, in Iceland, and notice the multitude of hues present in the band ratio visualisation.

Katla, Iceland
Searching for the keywords volcanic island and mountain leads us to a website that, at first glance, seems probable to contain a list of all volcanic islands, so we click on it. It leads to an outdated, 2015 website with one example of a volcanic island given: Mauna Loa, Hawaii.

Looking it up through the MIE, we notice it’s an exact hit for our point of interest.

Mauna Loa, Hawaii
Splendid! To determine the highest peak, we can use a tool called PeakVisor. Coincidentally, the peak is named after the mountain, but keep the tool around for other opportunities.
Answer: Mauna Loa
Conclusion
This was my first time solving OSINT challenges from Bellingcat, which also marks my first time tackling thematic challenges of this nature. The key take-aways for me have come from the research done on band ratios and reflectance values for different materials. It’s unbelievable how much information can be gathered from a few images taken from a satellite.
A warm thank you to Galen and Agnes Cameron for the learning opportunity!